The year 2020 was a promising year for bio-based polymers: Sold out PLA in 2019 has led to the installation of increased capacities, PE and PP made from bio-based naphtha are breaking ground and future expansion for bio-based polyamides as well as for PBAT, PHAs and casein polymers is on the horizon. A lower production is only observed for bio-based PET.
Visuals and PDF files in German and English available at: www.nova-institute.eu/press/?id=237.
Several global brands are already expanding their feedstock portfolio to include, next to fossil-based, sources of renewable carbon, CO2, recycling and especially biomass, increasing the demand for bio-based as well as biodegradable polymers. Nevertheless, at the same time, there is a lack of support from politics, which still only promotes biofuels and bioenergy.
The new market and trend report “Bio-based Building Blocks and Polymers – Global Capacities, Production and Trends 2020–2025” from the international nova biopolymer expert group shows capacities and production data for all bio-based polymers in the year 2020 and a forecast for 2025.
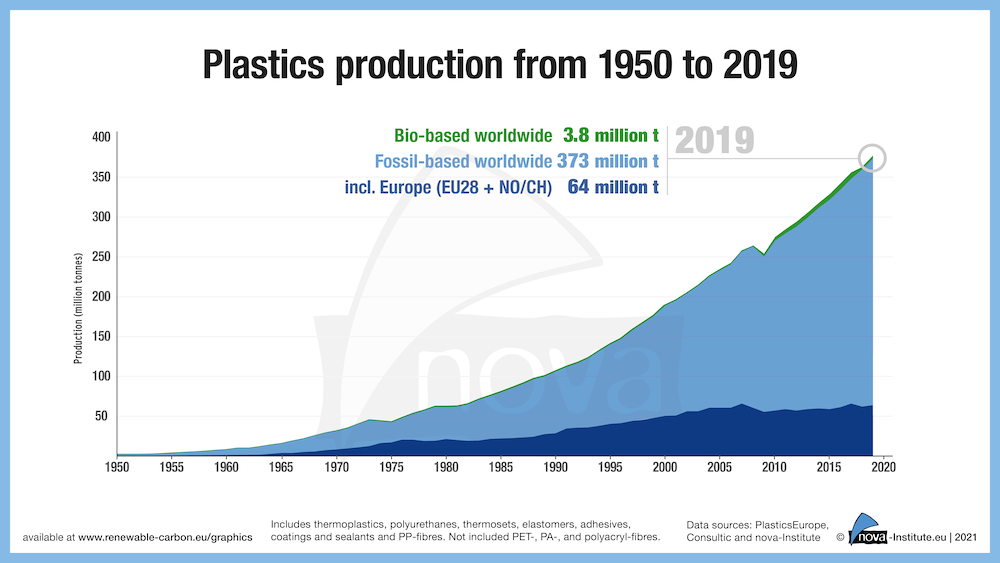
In 2020, the total production volume of bio-based polymers was 4.2 million tonnes, which is 1 % of the total production volume of fossil-based polymers. For the first time in many years, the CAGR is, with 8 %, significantly higher than the overall growth of polymers (3–4 %) – this is expected to continue until 2025 (Figure 1).
Overall, the global land requirement for bio-based polymers is only 0.006 % of the global agricultural land. The major biomass feedstock used for bio-based polymer production is glycerol as a biogenic by-product (37 %).
In the annually updated market report for the year 2020, a total of 17 bio-based building blocks and 17 polymers are described, in addition to comprehensive information on the capacity development from 2020 to 2025 and production data for 2020 per bio-based polymer. Furthermore, the issue includes analyses of market developments and producers per building block and polymer, so that readers can quickly gain a comprehensive overview of current developments that goes far beyond capacity and production figures. As an additional bonus the report provides a detailed, comprehensive expert view on bio-based naphtha. Finally, the deep insight into manufacturing companies introduced in 2018 has been comprehensively updated and now shows 174 detailed company profiles – from start-ups to multinational corporations.
The data published annually by European Bioplastics (www.european-bioplastics.org/market) are taken from the market report published by nova-Institute, but with a smaller selection of bio-based polymers.
The market and trend report was written by the international nova biopolymer expert group. The corresponding authors are from Asia, Europe and North America. The 2020 report is now available for € 3,000 at www.renewable-carbon.eu/publications – in addition to further market studies on renewable carbon. A short version of the report will soon be available here, also.
If you want to meet the authors and discuss the market data personally, then do not miss the nova Session: “Renewable Polymers: Production and Trends 2020-2025” on 17 February 2021, online. Register now and get one of the limited spots.
www.renewable-carbon.eu/events/polymer-session
End of the short version, long version of the press release continues here.
Capacity increase
The increase in production capacity from 2019 to 2020 is mainly based on the expansion of polylactic acid (PLA) and poly(butylene adipate-co-terephthalate) (PBAT) production in Asia and the worldwide epoxy resin production. Also, increased and new production capacities for polybutylene succinate and copolymers (PBS(X)) and bio-based polyethylene (PE) and polyurethanes (PUR) were reported in 2020. Especially polyamides (PA) and polypropylene (PP) will continue to grow significantly (about 36 %) until 2025. While capacities for polyhydroxyalkanoates (PHA) will grow in Asia and North America, casein polymers in Europe will increase by 32 % until 2025, followed by increases in PE in South America and Europe, PLA mainly in Europe and PBAT in Asia with about 8 %.
Bio-based feedstocks
Considering the steadily increasing demand for bio-based polymers, the need for biomass feedstocks should be taken into account as an important factor. This is especially true for the recurring debate on the use of food crops for bio-based polymer production. Figure 2 shows the worldwide biomass utilisation in 2020.
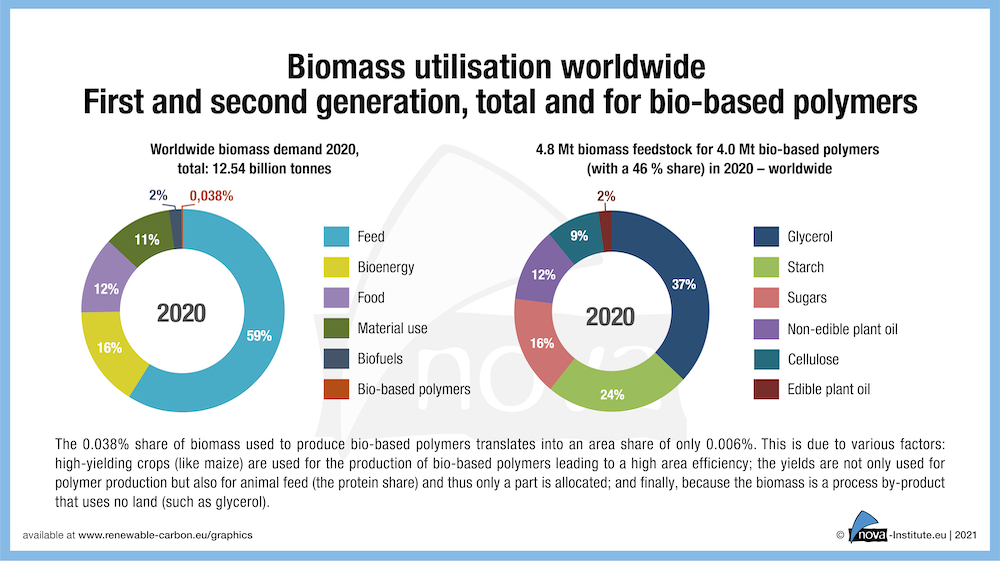
The total demand for biomass was 12.5 billion tonnes for feed, bioenergy, food, material use, biofuels as well as bio-based polymers. While the majority of the biomass (59 %) is used for feed production, only 0.038 % are needed for bio-based polymer production. That results in a biomass feedstock demand of 4.8 million tonnes for the production of 4 million tonnes of bio-based polymers and corresponds to an agricultural land share of only 0.006 %. This small area share is due to various factors: The major feedstock used for bio-based polymer production is glycerol (37 %), as a biogenic process by-product from biodiesel production it represents a biomass without land use. This glycerol is mainly used for epoxy resin production via epichlorohydrin as an intermediate. The utilised biomass also comprises 24 % starch and 16 % sugars, both feedstocks are derived from high-yielding crops, such as maize, sugar beet or sugar cane, having a high area efficiency. 12 % of the biomass are from non-edible plant oil, such as castor oil, 9 % from cellulose (mainly used for cellulose acetate) and 2 % from edible plant oil.
From the 4 million tonnes of produced bio-based polymers (fully and partly bio-based) only 1.9 million tonnes are actual bio-based components of the polymers (46 %) (Table 2). Considering this fact, 2.5 times more feedstock is needed than actually is incorporated into the final product. This amount of 2.9 million tonnes (61 %) of feedstock that is not ending up in the product is due to a high number of conversion steps and related feedstock and intermediate losses, as well as the formation of by-products.
Sustainability and renewable carbon
The only way for polymers, plastics and chemicals to become sustainable, climate-friendly and part of the circular economy is the complete substitution of fossil carbon with renewable carbon from alternative sources: biomass, CO2 and recycling (www.renewable-carbon.eu). This necessary transition is already on the strategic agenda of several global brands, that are already expanding their feedstock portfolio to include, next to fossil-based, all three sources of renewable carbon. This rethinking from the market point of view, especially in the use of biomass, will, and already did, increase the supply of bio-based as well as biodegradable polymers. Nevertheless, the market remains challenging from a political perspective and in terms of crude oil prices, as major advantages of bio-based polymers have not been politically rewarded yet: 1) Bio-based polymers replace fossil carbon in the production process with renewable carbon from biomass. This is indispensable for a sustainable, climate-friendly plastics industry. 2) Biodegradability is offered by almost half of the produced bio-based polymers. This can be a solution for plastics that cannot be collected and enter the environment. In these situations, they can biodegrade without leaving behind microplastics. Only a few countries such as Italy, France and probably Spain will politically support this additional disposal path.
Drivers and policy
The most important market drivers in 2020 were brands that want to offer their customers environmentally friendly solutions and critical consumers looking for alternatives to petrochemical products.
If bio-based polymers were to be accepted as a solution and promoted in a similar way as biofuels, annual growth rates of 10 to 20 % could be expected. The same would apply, should the oil price rise significantly. Based on the already existing technical maturity of bio-based polymers, considerable market shares could be gained in these cases.
Bio-based polymers
The global polymer market includes functional and structural polymers, rubber products as well as man-made fibres (Figure 3).
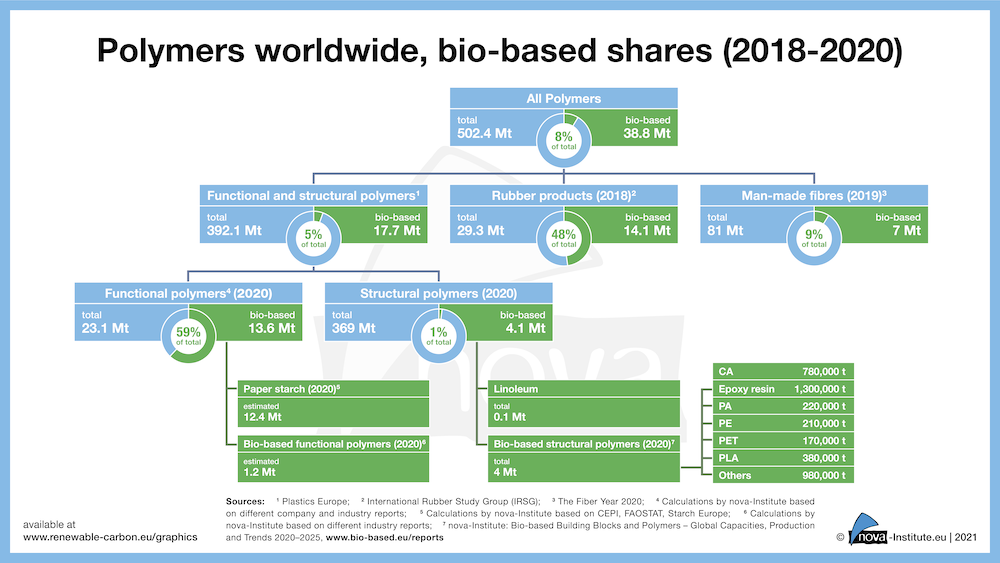
This report focuses on the bio-based share of the structural polymers. Bio-based structural polymers are composed of the structural part, exhaustively reviewed in this report and the bio-based linoleum part. Together amounting to 4.1 million tonnes. On the other hand, the total amount of bio-based functional polymers consists of bio-based functional polymers and paper starch, yielding 13.6 million tonnes. Besides these two groups making up 17.7 million tonnes of bio-based functional and structural polymers, also rubber products and man-made fibres can be bio-based. In total,14.1 million tonnes of rubber products and 7 million tonnes of man-made fibres are from bio-based resources.
Figure 4 shows all (semi-)commercial pathways from biomass via different intermediates and building blocks to bio-based polymers. As in previous years, several pathways and some new intermediates were added. Bio-based building blocks and polymers analysed in detail within the report are highlighted in bold.
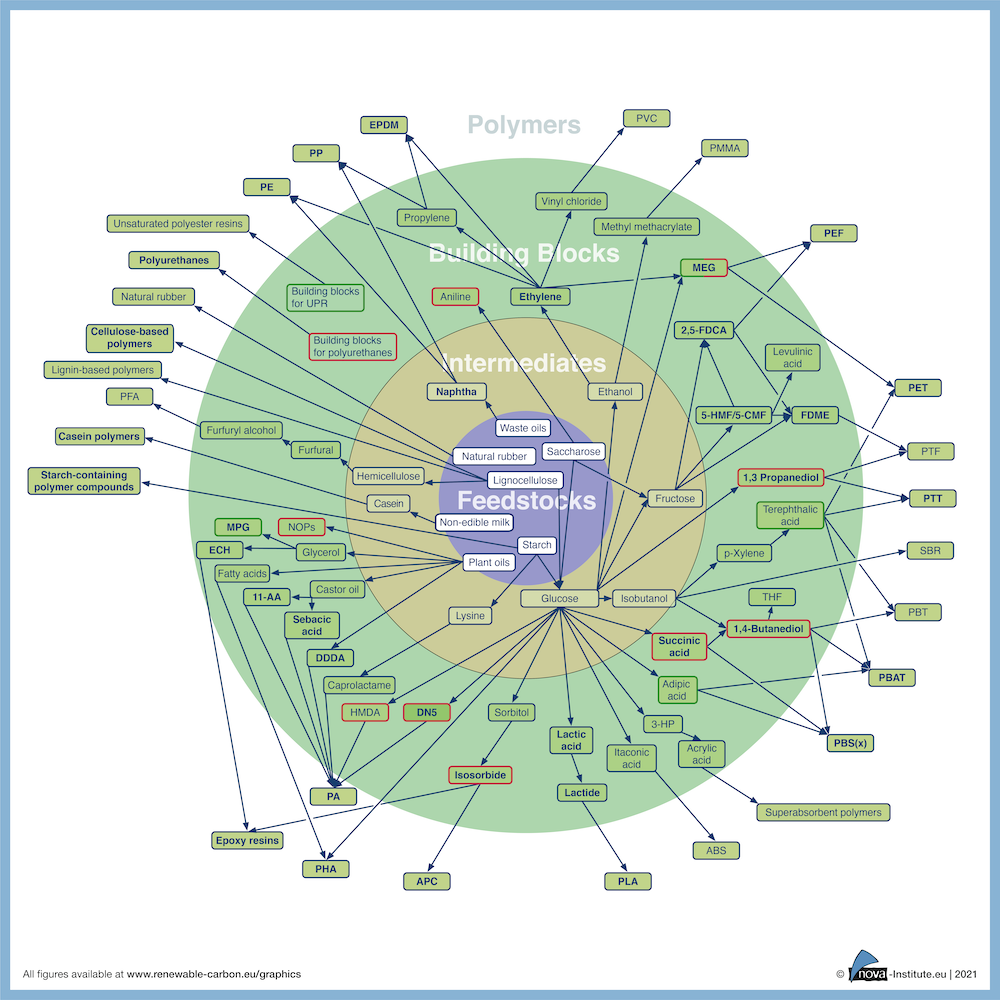
Figure 5 shows the different pathways of bio-based “drop-in”, “smart drop-in” and “dedicated” inputs within the chemical production chain. For each group, certain bio-based polymers are exemplarily shown. Additionally, biodegradable bio-based polymers are highlighted with a green dot. The different bio-based polymer groups are subject to different market dynamics. While drop-ins have direct fossil-based counterparts and can substitute them, the dedicated ones have new properties and functionalities that petrochemistry does not provide. Both have their own advantages and disadvantages from a production and market perspective. While bio-based drop-in chemicals are bio-based versions of existing petrochemicals, which have established markets and are chemically identical to existing fossil-based chemicals, smart drop-in chemicals are a special sub-group of drop-in chemicals. Even though they are chemically identical to existing chemicals based on fossil hydrocarbons, their bio-based pathways provide significant process advantages compared to the conventional pathways. Additionally, these bio-based pathways can be built on completely new approaches, such as epichlorohydrin, where the fossil feedstock propylene is not substituted by bio-based propylene but with glycerol from biodiesel production. Dedicated bio-based chemicals are chemicals which are produced commercially via a dedicated pathway and do not have an identical fossil-based counterpart.
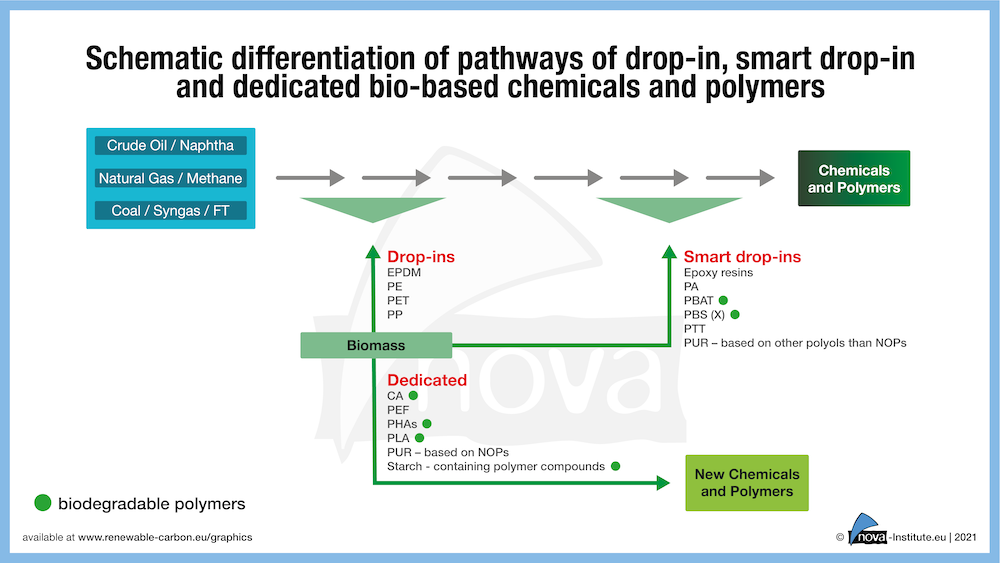
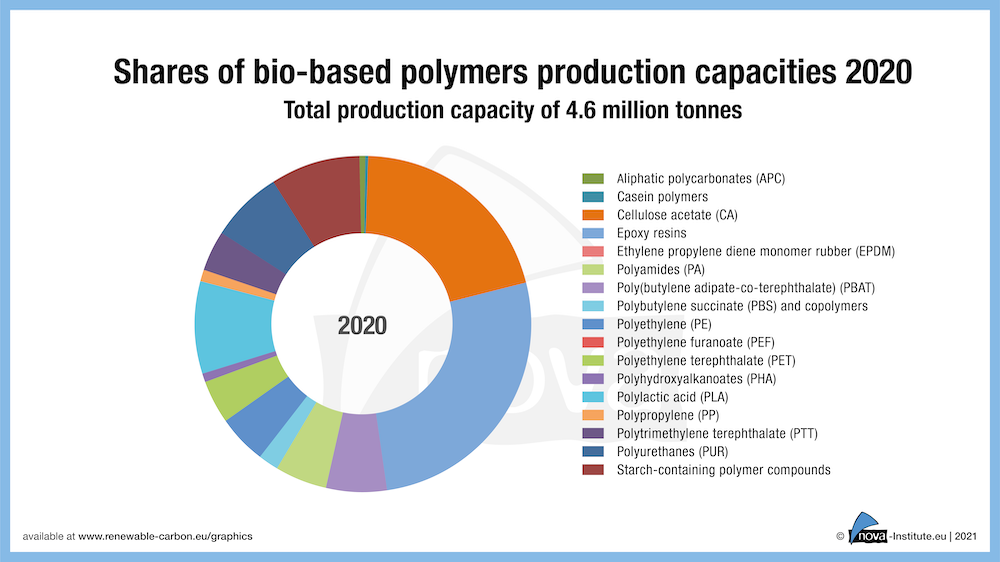
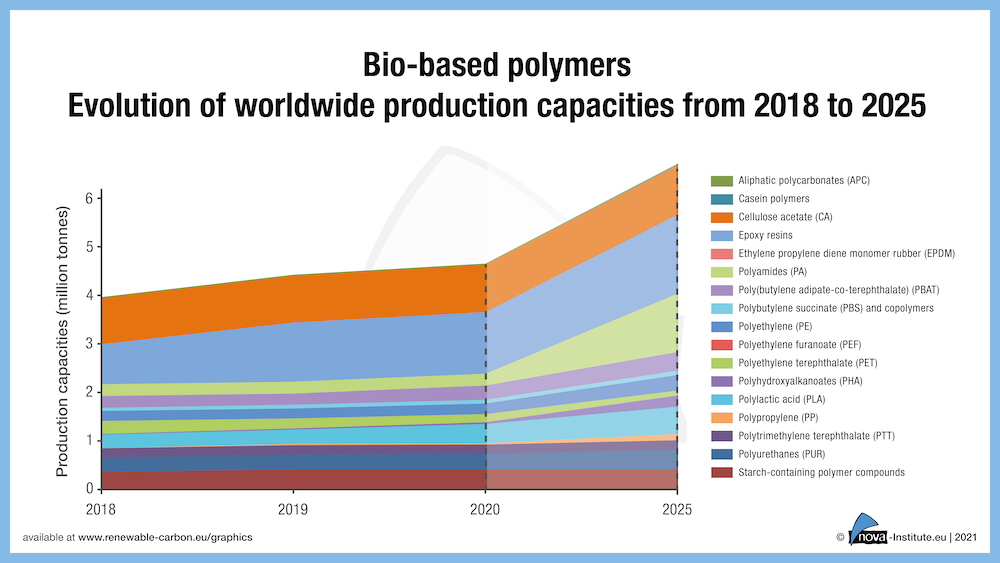
Figure 6 and Figure 7 summarise the results of the report and show the share of the bio-based polymer production capacities in 2020 and the development of capacities from 2018 to 2025 on the basis of forecasts by current and some new producers. The total installed capacity in 2020 was 4.6 million tonnes with an actual production of 4.2 million tonnes. An increase to 6.7 million tonnes capacity in 2025 is expected, indicating an average compound annual growth rate (CAGR) of about 8 %. The following polymers show an even higher increase significantly above the average growth rate: PA will continue to grow by 37 % and PP by 34 % until 2025. Casein polymers in Europe will increase by 32 % until 2025, followed by 8 % increases in PE and a 7 % growth for PLA and PBAT.
Bio-based building blocks
Figure 8 illustrates the development of capacities for the main bio-based building blocks used for the production of polymers from 2011 to 2025. The building blocks are utilised for the synthesis of structural and functional polymers as well as ingredients in various other applications such as food, feed, cosmetics or pharmaceuticals, and therefore show a higher average CAGR than polymers.
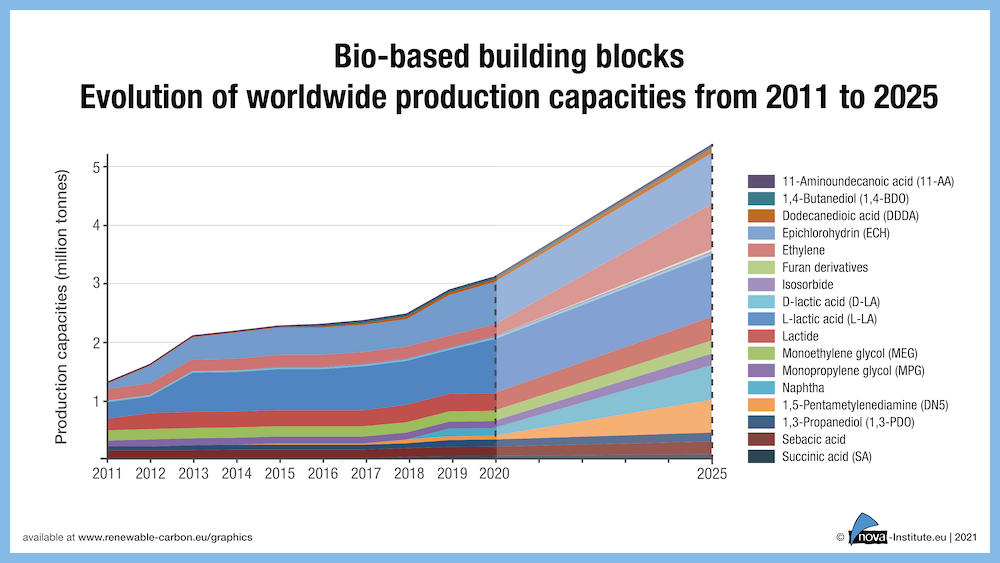
The overall production capacity of bio-based building blocks increased about 7 % (212,000 t/a) in 2020. This increase is mainly based on L-lactic acid and epichlorohydrin (ECH). The overall forecast for bio-based building blocks worldwide indicates a growth by 11 % (CAGR) until 2025, with 1,5-pentamethylenediamine (DN5), naphtha, ethylene and different furan derivatives being the main drivers.
Global production capacities of bio-based polymers by region
After Asia as leading region, which has installed the largest bio-based production capacities worldwide with 47 % in 2020, Europe follows with 26 %, followed by North America with 17 % and South America with 9 %, respectively (Figure 9).
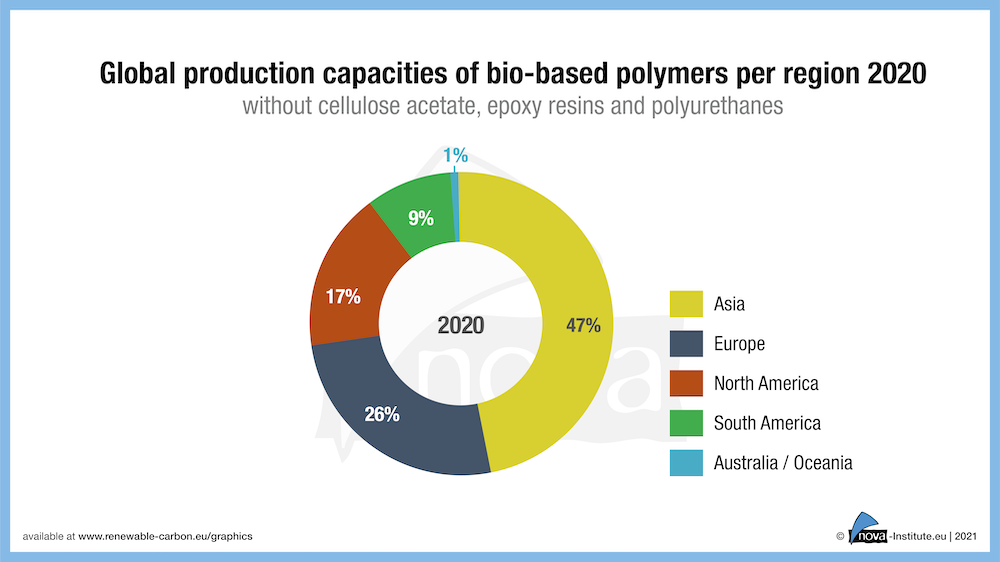
With an expected CAGR of 16 % between 2020 and 2025, Asia displays the highest growth of bio-based polymer capacities compared to other regions of the world. This increase is mainly due to higher production capacities for PA, PBAT, PHA and PLA.
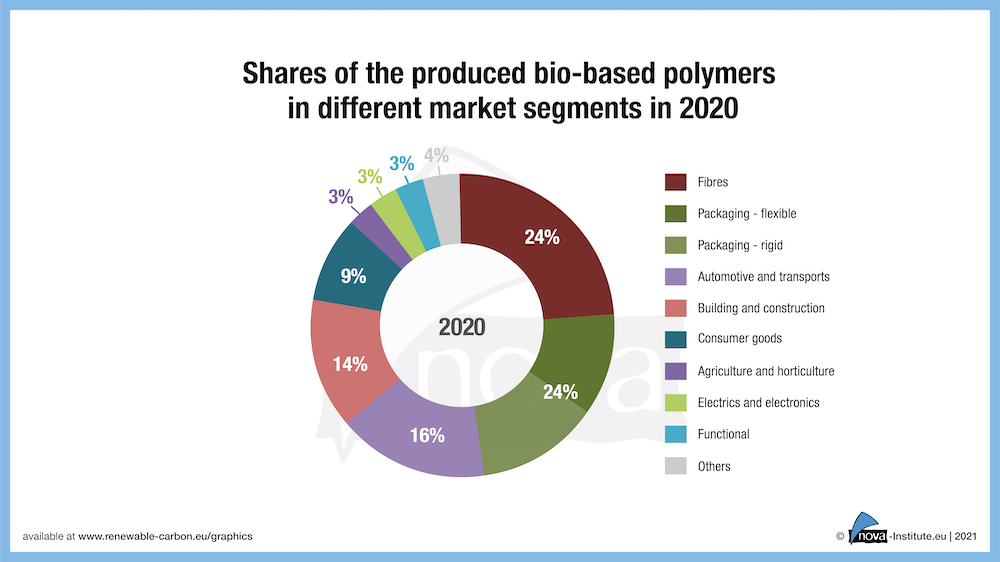
Market segments for bio-based polymers
Today, bio-based polymers can be used in almost all market segments and applications, but the various applications per polymer can be very different. Figure 10 shows a summary of the applications for all bio-based polymers covered in the report. In 2020 fibres including woven, non-woven (mainly cellulose acetate (CA) and polytrimethylene terephthalate (PTT)) have the highest share with 24 %. Packaging, flexible and rigid, also have a 24 % share in total, followed by automotive and transport with 16 % (mainly epoxy resins, PUR and aliphatic polycarbonates (APCs)), building and construction with 14 % (mainly epoxy resins and PA), consumer goods with 9 % (mainly starch-containing polymer compounds, PP and casein polymers). The market segments agri- and horticulture, electrics and electronics as well as functional and others have a market share of under 5 %, respectively.
Source
nova-Institut GmbH, press release, 2021-01-28.
Supplier
Share
Renewable Carbon News – Daily Newsletter
Subscribe to our daily email newsletter – the world's leading newsletter on renewable materials and chemicals