Visuals, German version and PDF file available at: http://nova-institute.eu/press/?id=164
Lower production is seen particularly in bio-based PET. At the same time, there is a lack of support from policy makers, who are taking bio-based and biodegradable plastics into collective punishment with fossil plastics in the Plastic Policy. www.bio-based.eu/reports
The new market and trend report “Bio-based Building Blocks and Polymers – Global Capacities, Production and Trends 2019-2024” from the German nova-Institute shows capacities and production data for all bio-based polymers in the year 2019 and a forecast for 2024. In 2019, the total production volume of bio-based polymers was 3.8 million tonnes, which is 1% of the production volume of fossil-based polymers and about 3% more than in 2018 – this CAGR is expected to continue until 2024. The major biomass feedstock used for bio-based polymer production are biogenic by-products (46%), especially the by-product glycerol from the biodiesel production, used for epoxy resin production.
The production of bio-based polymers has become much more professional and differentiated in recent years. A large number of different producers and suppliers came into play to create bio-based alternatives for practically every application. The already large number of players in the bio-based polymer field, many situated in Asia, makes it difficult to verify each announced and installed capacity and their actual production. Detailed research, including interviews with international experts and players in the bio-based polymer field have now made it possible to draw a verified and realistic view on the market. The results look at an even smaller bio-based polymer market than formerly assumed: The market share of bio-based polymers in the total polymer and plastics market is 1% (3.8 million tonnes in 2019). The capacities and production of bio-based polymers will continue to grow with an expected CAGR of about 3% until 2024, which is almost the same predicted growth rate as for fossil-based polymers and plastics (Figure 1).
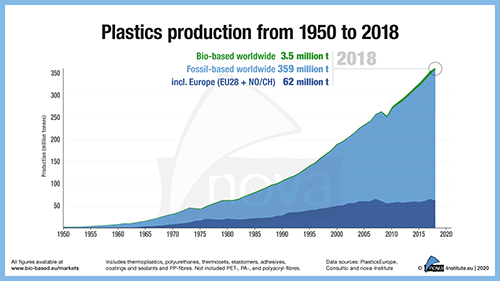
The increase in production capacity from 2018 to 2019 is mainly based on the expansion of poly(butylene adipate-co- terephthalate) (PBAT) production in Europe, worldwide epoxy resin production and European production of starch-containing polymer compounds. Also, increased and new capacities of polybutylene succinate and copolymers (PBS(X)), bio-based polyethylene (PE) and polypropylene (PP) – for the first time commercially available – were reported in 2019. Especially epoxy resins and PP will continue to grow significantly until 2024. Additionally, polyhydroxyalkanoates (PHA) capacities will increase by 2024. In 2019, detailed research on the bio-based structural polymer market unveiled significant changes and a former misinterpretation of available, but non-transparent market numbers. Therefore, the actual global production volume for bio-based polymers in 2018 is much smaller than the one reported in the previous report (Figure 1).
Considering the future steady increase of bio-based polymers, the biomass feedstock requirement is a necessary factor to consider. This is especially true for the recurring debate on the use of food crops for bio-based polymer production. Figure 2 shows the percentage distribution of the 5 million tonnes biomass needed for the worldwide production of 3.6 million tonnes of bio-based polymers.
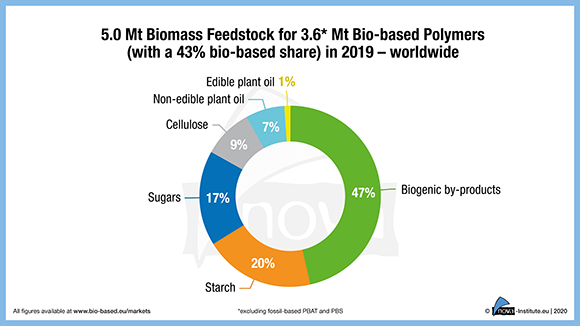
The major biomass feedstock used for bio-based polymer production are biogenic by-products (46%), especially the by-product glycerol from the biodiesel production, which is mainly used for epoxy resin production via epichlorohydrin as an intermediate. 37% of the required biomass are made up by starch and sugars, 8% by cellulose (mainly for cellulose acetate) and 9% by edible and non-edible plant oils, such as castor oil. From the 3.6 million tonnes of produced bio-based polymers (fully and partly bio-based, excluding fossil-based biodegradable PBAT and PBS) only 1.6 million tonnes are actual bio-based parts of the polymers (43%). Considering this fact, 3 times more feedstock is needed than used for product formation. This amount of over 3.4 million tonnes (68%) of feedstock that is not ending up in the product is due to high number of conversion steps and related feedstock and intermediate losses.
Overall, the market environment remains challenging with low crude oil prices and little political support.
- So far, the two major advantages of bio-based polymers have not been politically rewarded. The first advantage is that bio-based polymers replace fossil carbon in the production process with renewable carbon from biomass. This is indispensable for a sustainable, climate-friendly plastics industry and is not yet politically rewarded.
- The second advantage is offered by more than half of the produced bio-based polymers: they are biodegradable (depending on the environment) and can therefore be a solution for plastics that cannot be collected and enter the environment. In these situations, they can biodegrade without leaving behind microplastics. Only a few countries such as Italy, France and probably Spain will politically support this additional disposal path.
- In 2019, the European Union’s single-use plastic ban was adopted. It will enter into force in summer 2020. Biodegradability and bio-based origin are not recognised as grounds for exemption from the ban. Almost all bio-based and biodegradable polymers are put under collective punishment together with fossil plastics and are banned as well. Only so-called “natural polymers”, polymerised by nature, are exempt.
- Under the microplastics restriction currently being worked on in the REACH regulation, PHBs will probably be exempted from a microplastic ban. In summer 2020, the final regulation is expected.
The most important market drivers in 2018 and 2019 were brands that want to offer their customers environmentally friendly solutions and critical consumers looking for alternatives to petrochemicals. If bio-based polymers were to be accepted as a solution and promoted in a similar way as biofuels, annual growth rates of 10 to 20% could be expected. The same applies should the price of oil should rise significantly. Based on the already existing technical maturity of bio-based polymers, considerable market shares could be gained in these cases.
For 2019, the annually updated market report includes significant changes and some new features: It contains comprehensive revised information on the capacity development from 2019 to 2024, per bio-based building block and polymer, as well as production data for the year 2019, per bio-based polymer.
Also, the so-called calculated bio-based content is provided within this issue. This is the bio-based content dependent on the average bio-based content of the respective polymer.
A total of 18 bio-based building blocks and 17 polymers are covered in the 2019 report. Bio-based naphtha and casein polymers are added as a new building block and polymer group. Furthermore, the new issue includes analyses of market developments and producers per building block and polymer, so that readers can quickly gain an overview of developments that go far beyond capacity and production figures.
As an additional bonus, the report provides a detailed, comprehensive expert view on the current state and future development of the biomass balance approach.
Since the 2018 issue, each update of the report includes a detailed research of the market development of specific bio-based polymers. The market report for 2019 includes comprehensive calculations and explanations on bio-based polyethylene terephthalate (PET) and bio-based polyurethanes (PUR). This intensive analysis was possible through direct collaboration with the main experts in this area. Finally, the in 2018 introduced deep dive into the producing companies was comprehensively updated and now shows 170 detailed company profiles – from start-ups to multinational corporations.
The data published annually by European Bioplastics (www.european-bioplastics.org/market) are taken from the market report of nova-Institute, but with a reduced selection of bio-based polymers.
The market and trend report is written by the international biopolymer expert group headed by nova-Institute. The corresponding authors come from Asia, Europe and North America. The 2019 report is now available for 3,000 € at www.bio-based.eu/reports – in addition to further market studies on different topics of bio- and CO2-based economics. Here, also a short version of the report will soon be available.
If you want to meet the authors and discuss the market data personally, then do not miss the nova Session “Bio-based Building Blocks and Polymers – Global Capacities, Production and Trends 2019-2024” on 9 March 2020 at Cologne/Bonn airport. If you purchase the new market report “Bio-based Building Blocks and Polymers – Global Capacities, Production and Trends 2019-2024” you will get a 70% discount on the registration fee for the nova Session. Register now and get one of the limited spots. www.bio-based.eu/biopolymer-session/
End of the short version, long version of the press release continues here.
Bio-based Polymers
The global polymer market includes functional and structural polymers, rubber products as well as man-made fibres (Figure 3). This report focuses on the bio-based part of the structural polymers. Figure 4 shows all potential pathways from biomass via different intermediates and building blocks to bio-based polymers. As in previous years, several pathways and some new intermediates were added, but not all mentioned building blocks and polymers are covered in the report. Bio-based building blocks and polymers analysed in detail within the report are highlighted in bold. Figure 5 shows the different pathways of bio-based “drop-in”, “smart drop-in” and “dedicated” inputs within the chemical production chain. For each group, certain bio-based polymers are exemplarily shown. Additionally, biodegradable bio-based polymers are highlighted with a green dot. The different bio-based polymer groups are subject to different market dynamics. While drop-ins have direct fossil-based counterparts and can substitute them, the dedicated ones have new properties and functionalities that petrochemistry does not provide. Both have their own advantages and disadvantages from a production and market perspective. Figure 6 summarises the results of the report and shows the development of capacities from 2019 to 2024 on the basis of forecasts by current and some additional producers. Here an increase is shown from an installed 4.3 million tonnes capacity, resulting in 3.8 million tonnes of production in 2019 to 4.9 million tonnes capacity in 2024, which indicates an expected compound annual growth rate (CAGR) of about 3%. Despite the main drivers for capacity increase in 2024 – epoxy resins and, presumably, PHA and PP – also the capacities for bio-based polyamides (PA), bio-based polyethylene (PE) as well as polylactic acid (PLA) will increase.
Bio-based Building Blocks
Figure 7 illustrates the development of capacities for the main bio-based building blocks used for the production of polymers from 2011 to 2024. The building blocks are utilised for the synthesis of structural and functional polymers as well as ingredients in various other applications such as food, feed, cosmetics or pharmaceuticals. The overall production capacity of bio-based building blocks increased about 8% (230,000 t/a) in 2019, although some pioneers went bankrupt. This increase is mainly based on epichlorohydrin (ECH) and the production of the newly added building block bio-based naphtha. The overall forecast for bio-based building blocks worldwide indicates a growth by 5% (CAGR) until 2024, with 1,4-butanediol (1,4-BDO), different furan derivatives, L-lactic acid, naphtha and 1,3-propanediol (1,3-PDO) being the main drivers.
Global production capacities of bio-based polymers by region
After Asia as the leading region, which has installed the largest bio-based production capacities worldwide with 45% in 2019, Europe follows with 26%, North America with 18% and South America with 10% respectively. In the next five years, the share of Europe will rise to 31% – all other regions will face decreasing shares (Figure 8). With an expected CAGR of 7% between 2019 and 2024, Europe displays the highest growth of bio-based polymer capacities compared to other regions of the world. This increase is mainly due to higher production capacities for PE, PP, PA, PHA, PEF and newly added casein polymers that are only produced in Europe.
Market segments for bio-based polymers
Today, bio-based polymers can be used in almost all market segments and applications, but the applications per polymer are very different. Figure 9 shows a summary of the applications for all bio-based polymers covered in the report. In contrast to 2018 (not shown in the figures of this report), where consumer goods make up the largest share of actually produced bio-based polymers, in 2019 textiles including woven, non-woven and fibres (mainly polytrimethylene terephthalate (PTT) and cellulose acetate (CA)) have the highest share with 20%. The decreased share in the consumer goods market segment is due to the correction of the large reported number for bio-based PUR in 2018. This leads also to a more balanced and equal distribution of the production shares within the different market segments: the textiles segment is followed by automotive and transport with 15%, building and construction with 13% (both mainly epoxy resins, PA and PUR), consumer goods with 13% (mainly epoxy resins, PA and PUR), flexible packaging also with 13% (mainly starch-containing polymer compounds, PBAT and PE) and rigid packaging with 11% (mainly PET, PLA and PBAT). The market segments electrics and electronics, functional as well as agri- and horticulture and others have a market share of under 10%.
Source
nova-Institut GmbH, 2020-01-27
Supplier
European Bioplastics e.V.
nova-Institut GmbH
Share
Renewable Carbon News – Daily Newsletter
Subscribe to our daily email newsletter – the world's leading newsletter on renewable materials and chemicals